An easy-to-use and configurable interface allows new users to be productive quickly.
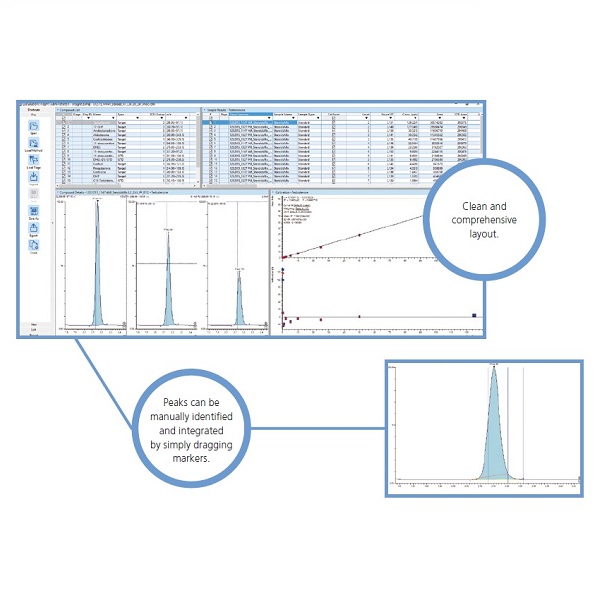
Multi-analyte Quantitation Software
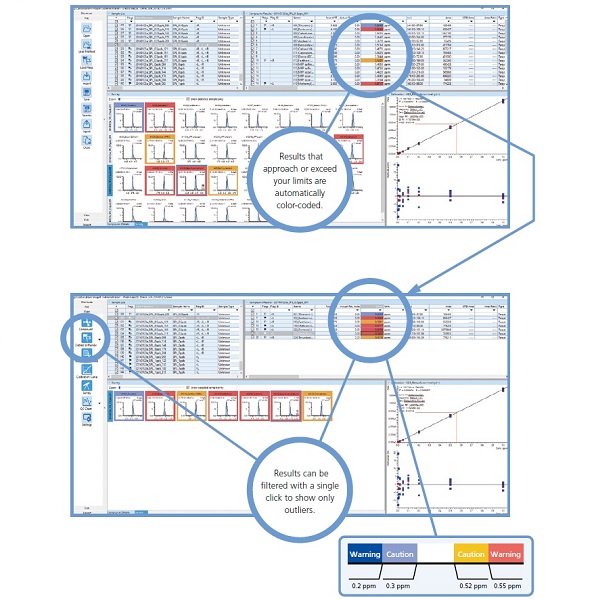
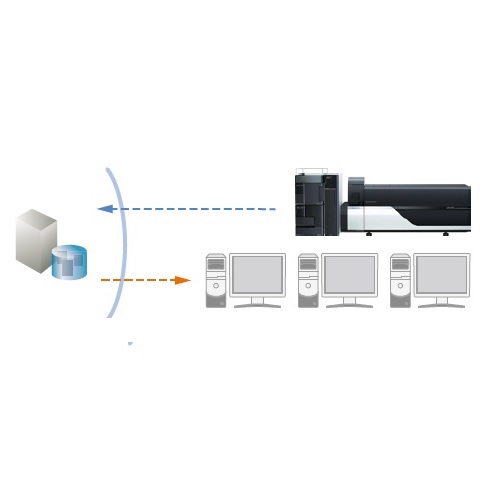
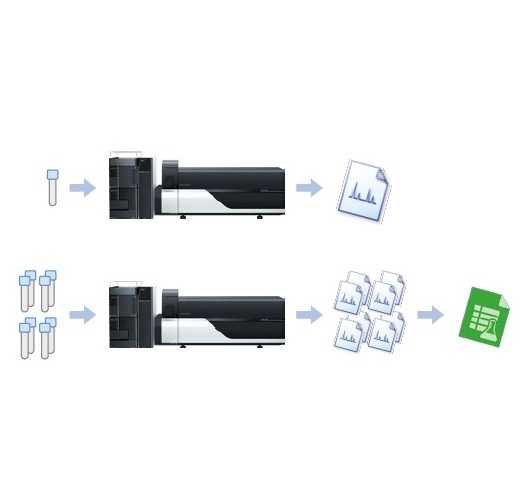
Mass spectrometry laboratories can acquire thousands of chromatograms per day. Insight provides tools to streamline data review and focus on the chromatograms that need critical attention. Insight automatically applies your peak detection criteria to data and flags any deviations, allowing you to analyze data more efficiently.
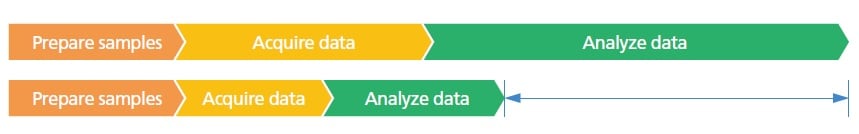
Reduce your data review bottleneck with Insight's customizable review screens and automated QA/QC flagging. Combined with Shimadzu's ultra-high-speed acquisition, a complete solution is offered to the high-throughput mass spectrometry laboratory.
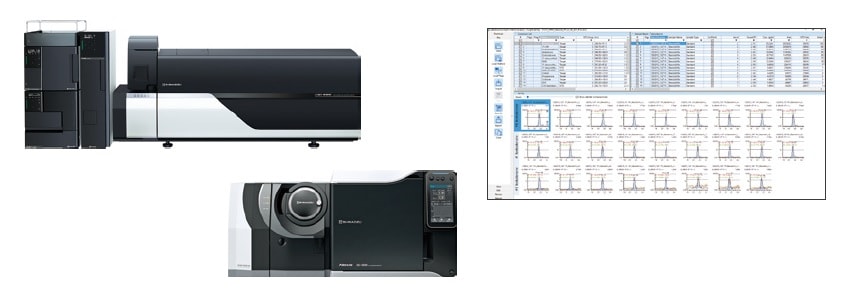
LabSolutions Insight Multi-Analyte Software for Mass Spectrometry
A New Algorithm for Peak Integration Peakintelligence
Peakintelligence is a new algorithm for peak integration. This was developed by deep-learning with thousands of real-world chromatogram data.Peakintelligence will give you a consistent peak integration without complex parameter settings, and accelerate data processing.

3 Good health and well-being